Feature engineering & EDA
FEATURE ENGINEERING & EDA

STEPS IN DATA PREPROCESSING:-
1. Validate your data
2. Handle Nulls in the dataset
3. Handling categorical columns
4. Handle Outliers
5.Handle Imbalanced data
6. Feature Selection
7.Scale your data
8.Split your data into
1. Validate your data
a. Info, Nulls, Describe
b. Check value_counts for some columns you doubt on (categorical)
2. Handle Nulls in the dataset
a. Remove Rows having Nulls (losing data)
In most of the cases removing the null values is not preferred. If we have millions of records & in that only less number of records are missing we can remove the null values.
b. Fill Values - mean, median, mode, ffill, bfill
The best way of dealing with null values is by filling the null values. Depending on the type of data we have we can fill the null values by using mean, median, mode, ffill & bfill.
-->Lets see some of the use cases to fill null values
- When we have a age column with null values fill the null value with mean or median.
- If we have categorical data we can fill the null values with mode
- We have stock value of a particular product of in 1/05/2022,2/05/2022 & 4/05/2022. The stock value of 3/05/2022 is missing in this condition it is always suggestable to fill the stock value of 3/05/2022 by using forward filling(ffill) i.e. in forward filling the stock value of 2/05/2022 is filled for 3/05/2022.
- Similarly in Backward filling we fill the stock value of 3/05/2022 is filled with the value of 4/05/2022.
- The major drawback in forward filling is if first row has null values means the null values will be maintained through out data & the vice-versa with backward filling.
Advantages And Disadvantages of Mean/Median Imputation:-
Mean/Median Imputation is easy to implement.
Median Imputation is not affected by outliers.
Mean/Median Imputation make changes in the original variance
Mean/Median Imputation Impacts the correlation.
By using the machine learning models such as KNN & Iterative Imputer methods also we can fill the null value
Click here to see how to handle with null values
3. Handling categorical columns
Lets discuss about types of Encoding. Their are two types of encoding
1) Nominal Encoding
2) Ordinal Encoding
1)Nominal Encoding:-
Nominal encoding is nothing but the features where variables have no order or rank to this variable's feature.
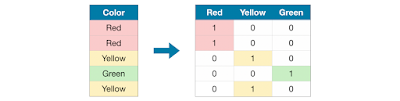
One Hot Encoder
If categories > 2 & <7 use One Hot Encoder. By using Label Encoder for the dataset which as more than 2 categories their is a chance of High Bias so by using One hot encoder we can removes the bias of higher numbers .

2)Ordinal Encoder:-
Ordinal Encoding is nothing but the feature where variables have some order or rank.

1)Label Encoding
2)Target guided ordinal Encoding.
Label Encoder
Label Encoder assign unique number (starting from 0) to each categories.
-->If we have nan values present in the data & after doing Label Encoding, the nan value also will be classified into separate category.

Advantages: -
1)Straightforward to implement
2)Does not require hours of variable exploration
3)Does not expand massively the feature space(no of columns in the dataset)
Disadvantages: -
1)Does not add any information that may make the variables more predictive
2)Does not keep the information of the ignored labels
Click here to see how to apply one hot encoder & Label Encoder
-->We can handle categorical columns by using a library present in pandas i.e. get_dummies
Click here to know how to apply get_dummies to handle categorical features
4. Handle Outliers
a. Remove outlier (Not recommended)
b. Clip
c. Make outliers as Nulls, and do Fill Missing
Which Machine Learning Models Are Sensitive To Outliers?
1. Naïve Bayes Classifier---------------------Not Sensitive To Outliers
2. SVM-------------------------------Not Sensitive To Outliers
3. Linear Regression-----------------Sensitive To Outliers
4. Logistic Regression---------------Sensitive To Outliers
5. Decision Tree Regressor or Classifier----Not Sensitive
6. Ensemble(RF,XGboost,GB)-----------Not Sensitive
7. KNN-------------------------------Sensitive
8. K Means---------------------------Sensitive
9. Hierarchal------------------------Sensitive
10. PCA------------------------------Sensitive
11. Neural Networks------------------Sensitive
How to find out the outliers:-
1)By Using Box plot:-
We can find the outliers by using box plot. We can consider the values as outliers if they are less than the minimum value & greater the maximum value from the Box plot

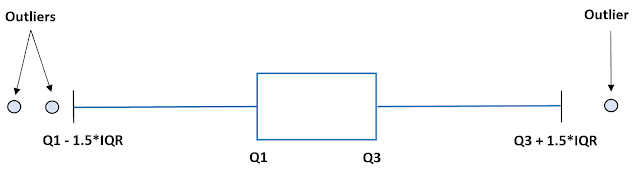
IQR=Inter Quartile Range=Q3 - Q1
Upper Quartile=Q3 + 1.5*IQR
5. Feature Selection
a. Manual Analysis
b. Univariate Selection
c. Feature Importance
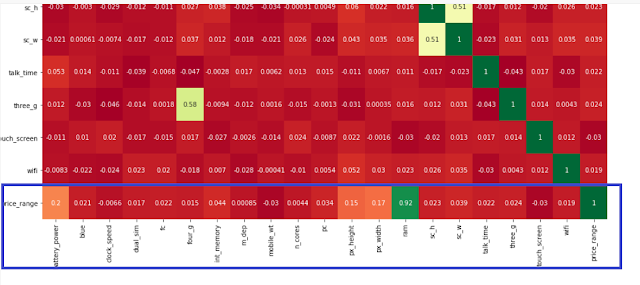
d. Correlation Matrix with Heatmap
e. PCA (Principle component analysis)
-->For selecting the features manually we will take the help of domain exports.
Ex: - While solving Banking domain problem statements we will take the help of banking domain people for selecting the features.
Univariate selection:-
In univariate selection we use the SelectKBest library present inside sklearn. SelectKBest internally applies chi-square test and give the out chi- square score. Based on this we will select top features.
Click here to see how to select features by using univariate selection
Feature Importance-
Correlation Matrix with Heatmap
6. Scale your data (Normalizes data in a certain range)
MinMax Scaler, Standard Scaler, Robust Scaler
Scaling helps to bring all Columns into Particular Range
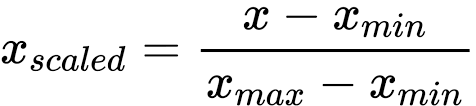
1)MinMax Scaler: -
MinMax scaler converts the data between 0 & 1 by using minmax formula.
-->Below is the formula of minmax scaler.
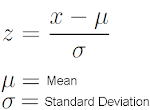
3)Robust Scaler: -
Robust Scaler is used to scale the feature to median and quantiles Scaling using median and quantiles consists of subtracting the median to all the observations, and then dividing by the interquartile difference.
IQR = 75th quantile - 25th quantile
X_scaled = (X - X.median) / IQR
Which Models require Scaling of the data?
1)Linear Regression-->Require
2)Logistic Regression-->Require
3)Decision Tree-->Not Require
4)Random Forest-->Not Require
5)XG Boost-->Not Require
6)KNN-->Require
7)K-Means-->Require
8)ANN-->Require
9)SVM-->Require
10)PCA -->Require
11)Naive byes -->Not require
i.e. distance based models & the models which uses the concept of Gradient Descent require Scaling.
-->fit_transform is applied only on the training dataset & on the testing dataset only transform is used, this is done to avoid data leakage.
Click here for complete end to end processing
Lets Discuss about some of the Automated EDA Library
Their are different kinds of Automated EDA Library.
-->Some of then are
1)DTale
2)Pandas Profiling
3)Seeetviz
4)autoviz
5)DataPrep
6)Pandas Visual Analysis
Click here to see how to apply the Automated EDA Library
Comments
Post a Comment